
More than two million wireless connections were made to the subway cell and wi-fi service; Sarah Kaufman was featured in AM New York’s article on this exciting development.
More than two million wireless connections were made to the subway cell and wi-fi service; Sarah Kaufman was featured in AM New York’s article on this exciting development.
In this thoughtful look at smart cities in Metropolis Magazine, the book by Anthony Townsend gets a big thumbs-up.
Full link: http://www.metropolismag.com/February-2014/Big-Data-Big-Questions/
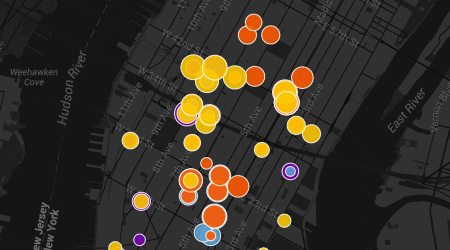
![ActiveStartStations_LGK_0108 [Converted]](https://nyurudincenter.wordpress.com/wp-content/uploads/2014/02/activestartstations_lgk_0108-converted.jpg?w=231&h=300)
NYU Rudin Center Director Mitchell L. Moss and Research Assistants Lily Gordon-Koven and Nolan Levenson presented new findings on CitiBike at the annual meeting of the Transportation Research Board in January.
Findings will be compiled into a post on this site, including interactive maps. A preview is at left, showing most active journey start stations – mostly around the city’s transit hubs. Check back for a full writeup this week.
Do pedestrians have more time to cross the street in DC than in NYC? It depends. Both cities have rapidly implemented “countdown” pedestrian signals to give pedestrians a better estimate of how much time they have to cross. This is particularly useful for those who may walk a bit slower than the “average” pedestrian, such as the elderly and disabled.

Countdown Pedestrian Signals in DC display the full cycle length. Source: Eric Fischer, Creative Commons / Flickr
At first glance, it may seem like pedestrians have longer to cross in DC, but here’s the secret: in the District, pedestrians are given the countdown of the full cycle length, whereas NYC pedestrians are only given the countdown for time just before the “don’t walk” phase (the blinking red light or the “clearance phase”).

Countdown Pedestrian Signals in NYC follow the MUTCD and only display “clearance times.” Source: Eric Fischer, Creative Commons/Flickr
Why does this difference exist? According to the signal bible, the Manual on Uniform Control Devices (MUTCD) published by the Federal Highway Administration, pedestrian signals should look like the ones in NYC. But wouldn’t you want to know how much time you have total? Not just the “clearance time”?
Are government officials in DC a bunch of rule breakers? Actually, DC was a trial city for implementation of full countdown clocks, but the results of this “test” have yet to be released.
In general, the length of signals for pedestrians depends on volumes of people and traffic on the street. DC usually uses 100-second signal cycles (for all intersection movements) during peak hours, and 80-second signal cycles on nights and weekends. NYC varies much more, with cycle lengths between 45 and 120 seconds.
Sources: Sam Zimbabwe and George Branyan, DDOT; NYCDOT website
New book chapter published: “What’s the Worst That Can Happen? Social Media Protocols and Policies” in Best Practices for Transportation Agency Use of Social Media, CRC Press, October 2, 2013.
by Sarah M. Kaufman and Susan Bregman

Timely updates, increased citizen engagement, and more effective marketing are just a few of the reasons transportation agencies have already started to adopt social media networking tools. Best Practices for Transportation Agency Use of Social Media offers real-world advice for planning and implementing social media from leading government practitioners, academic researchers, and industry experts.
The book provides an overview of the various social media platforms and tools, with examples of how transportation organizations use each platform. It contains a series of interviews that illustrate what creative agencies are doing to improve service, provide real-time updates, garner valuable information from their customers, and better serve their communities.
It reveals powerful lessons learned from various transportation agencies, including a regional airport, city and state departments of transportation, and municipal transit agencies.
Filled with examples from transportation organizations, the text provides ideas that can apply to all modes of transportation including mass transit, highways, aviation, ferries, bicycling, and walking. It describes how to measure the impact of your social media presence and also examines advanced uses of social media for obtaining information by involving customers and analyzing their social media use.
The book outlines all the resources you will need to maintain a social media presence and describes how to use social media analytical tools to assess service strengths and weaknesses and customer sentiment. Explaining how to overcome the digital divide, language barriers, and accessibility challenges for patrons with disabilities, it provides you with the understanding of the various social media technologies along with the knowhow to determine which one is best for a specific situation and purpose
.

